
FINANCIAL DASHBOARDS AND ANALYTICS SOFTWARE

Finance Builds It, The Business Sees It and Everyone Acts

Actuals, budgets, and forecasts in one connected visual layer. No BI team needed.

FPA Plus Dashboard
THE CHALLENGE

The Data Exists But Insight Doesn't Get There in Time

Prophix Visual Analytics Colour

Dashboards Are Built By IT, Not Finance

In most mid-market organizations, getting a dashboard built means submitting a request to IT, waiting weeks, and receiving something that doesn't reflect how finance thinks about the data. When assumptions change or a new KPI matters, the cycle starts again. Finance owns the numbers but not the visualization layer, so the story the data tells is always someone else's version of it.

Prophix Error Colour

Business Leaders Are Flying Blind Between Finance Updates

Department heads and business unit leaders need current financial context to make good decisions. Between reporting cycles, they're flying blind. They either wait for finance to send a report or make decisions without the numbers. Neither works.

Prophix Decision Making Colour

Every New Data Question Requires a New Report Request

A board member asks a follow-up after the meeting. A business unit leader wants a different cut of the regional data. A CFO wants to see the same KPIs sliced by product line instead of geography. Each request lands in finance's queue as a custom build.

KEY CAPABILITIES

Prophix One Gives Every Stakeholder the View They Need to Act

Four capabilities that connect financial data to visual insight, built by finance, consumed by the business, governed end to end.

FPA Plus Dashboard

Finance-Built Dashboards

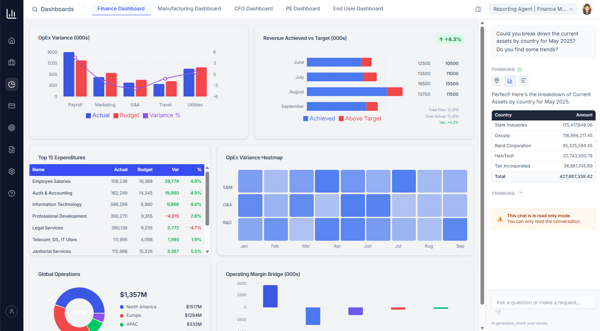
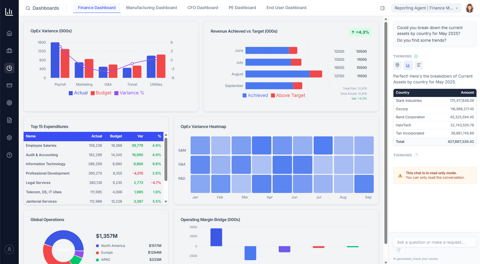
Build dashboards directly inside Prophix One without IT involvement, BI consultants, or custom development. Drag-and-drop configuration lets finance define the metrics, dimensions, and visual formats that reflect how the business measures performance. Templates can be standardized across entities and refreshed automatically each period.

Ad Hoc POI

Self-Serve Analytics

Give department heads, business unit leaders, and executives access to the dashboards and data views relevant to their role. Powerful drill-downs let leaders move from summary KPIs to underlying detail without submitting a request to finance. Slice by period, entity, cost center, product line, or any dimension your data model supports.

Management Board Reporting

KPI Scorecards & Performance Tracking

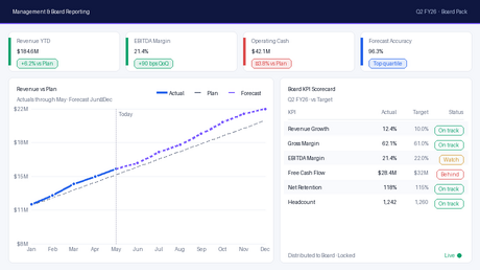
Define the KPIs that drive your business (revenue growth, gross margin, EBITDA, cash conversion, headcount efficiency, or any custom metric you track) and surface them in scorecards that update automatically as actuals post. Threshold-based indicators flag when performance is on track, at risk, or off plan. Scorecards can be published to specific audiences, embedded in board packs, or accessed on demand.

Copilot 430 450 2x

AI-Powered Analytics

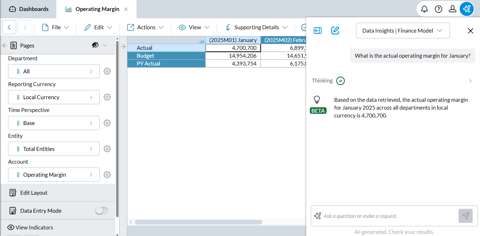
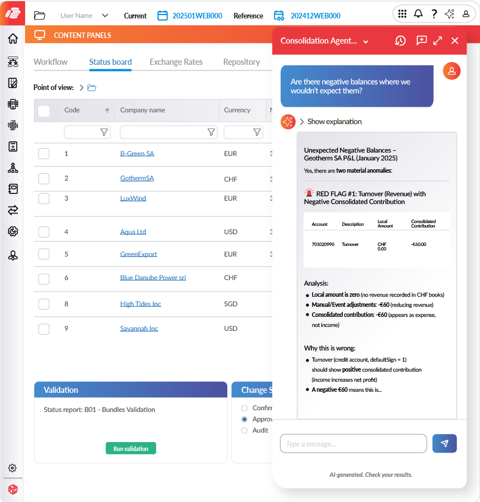
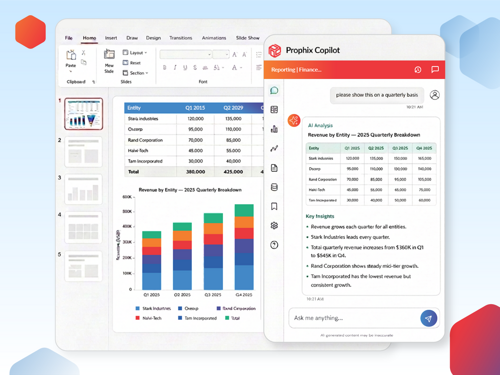
Prophix One Intelligence monitors your financial data continuously, surfacing anomalies, flagging trends that diverge from plan, and identifying the drivers behind performance before anyone thinks to ask. The platform tells finance what to look at. Automated narrative commentary explains what the visuals show in plain language, so every dashboard tells a complete story, not just a picture someone else has to interpret.

When the Business Can See the Numbers, Finance Can Lead the Conversation

Prophix One connects financial data to visual insight in a governed, self-serve layer that finance builds and the business uses. Every stakeholder arrives at every decision with the right numbers already in hand.

Frequently Asked Questions

What is Financial Dashboard Software and How is it Different From a BI Tool?

Financial dashboard software is built for how finance teams think about and present data: periods, entities, dimensions like cost center and product line, and comparisons of actuals to budget and forecast. General-purpose BI tools like Power BI or Tableau are powerful but require technical configuration, data modeling expertise, and often a dedicated BI team to maintain. Prophix One's visual analytics are native to the financial planning platform. Actuals, budgets, and forecasts are already connected, no custom data modeling required. Finance builds dashboards directly, without IT involvement, because the data structure is already built for financial analysis.

Prophix One's dashboard builder is designed for finance users, not technical users. Drag-and-drop configuration lets finance define metrics, choose visualization types, set dimensions and filters, and publish to specific audiences without writing code, building data models, or submitting requests to IT. Because Prophix One's data layer already connects actuals, budgets, and forecasts, the underlying structure is already in place. Finance focuses on what to show and how to show it, not on how to connect the data.

Prophix One is a single platform for financial planning and reporting, so actuals from your GL, your approved budget, and your current forecast all live in the same data environment. Dashboards draw from all three simultaneously without manual data assembly. When the period closes and new actuals post, every connected visualization updates automatically. When the forecast is revised, the dashboard reflects it immediately. No export-import cycle, no manual refresh, no risk of a dashboard showing stale data.

Self-serve analytics gives business leaders (department heads, regional managers, business unit executives) direct access to the financial data relevant to their area. They can drill down and slice the data themselves without asking finance to build a custom report. Role-based permissions ensure each stakeholder sees only the data they're authorized to access. Ad hoc report requests drop because the answer is already in the platform. Finance stops spending analyst time on routine data queries and redirects that capacity to higher-value work.

Finance defines the KPIs that matter to the business (revenue growth, gross margin, EBITDA, cash conversion, headcount efficiency, or any custom metric) and configures scorecards that update automatically as actuals post. Threshold-based indicators show whether each KPI is on track, at risk, or off plan at a glance, without requiring the viewer to interpret the underlying data. Scorecards can be published to specific audiences, embedded in board packages, or accessed on demand. For CFOs who want leadership aligned on the same metrics each period, KPI scorecards in Prophix One replace the manually updated Excel tracker that someone always forgets to refresh.

Prophix One Intelligence monitors financial data continuously and surfaces anomalies, trend divergences, and performance signals automatically, so finance isn't relying on stakeholders to notice something unusual in a chart. When a metric moves outside expected ranges, the platform flags it. Automated narrative commentary translates visual data into plain-language insight, so every dashboard tells a complete story rather than presenting numbers each viewer has to interpret independently. The result: faster insight delivery, more consistent analysis, and a finance team that's ahead of the question.