Variance analysis compares actual results against budgets and forecasts to reveal where performance diverges from plan, but the calculation is only the starting point — the value comes from identifying drivers, root causes and action items.
Finance and FP&A teams use price, volume, rate, and efficiency variances to decompose top-line differences into the specific components that explain what actually changed.
Materiality and persistence matter more than magnitude alone. A small variance that repeats every month often signals a bigger structural issue than a large one-off swing.
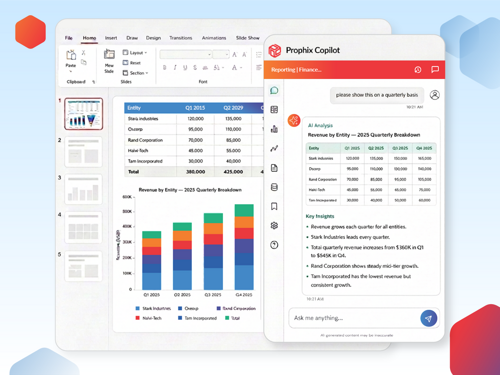
Automation and AI in FP&A compress the manual data pulls and let teams focus on interpretation, driver analysis, and management response — the work that actually informs decisions.
Comparing actual financial results against budgets and forecasts is vital for measuring performance and profitability. However, it’s important to follow a structured process to avoid blind spots. With variance analysis, finance and FP&A teams pinpoint where results diverge from plans, replacing assumptions with clear evidence.
Let’s explore the main variance types and formulae before covering driver analysis, data interpretation, and how finance decisions improve as a result.
What Is Variance Analysis and Why Does It Matter?
Variance analysis is the structured process of comparing actual financial results with budgets and forecasts. By analysing different variance types, finance and FP&A teams can identify where and by how much actual results differ from estimates.
Variance analysis in strategic finance is more than a simple calculation that shows a numerical difference. Analysis reveals areas where resources aren’t being prioritised, where spend has landed above or below plan, and surfaces data anomalies.
This makes it a vital management process that helps finance, FP&A, and business leaders make more nuanced decisions.
Typical variance comparisons include:
Budgets vs. actuals (how has the business performed against planning?)
Forecasts vs. actuals (are predictions accurate?)
Period-over-period or flux analysis (how has the business performed compared to previous time periods?)
Standard costs vs. actuals (are materials and labour costing the predicted amount?)
Depending on the variance types tracked, finance and FP&A teams can:
Reallocate resources based on performance
Improve forecasts based on historical errors
Re-align operational capacity with actual demand
Fix inefficiencies such as surplus labour hours
Build evidence to support shifting from static to rolling forecasts
Variance Analysis Formulae and Calculation Methods
Before we break down variances into components, let’s explore the core formulae finance teams use to calculate variance — starting with basic dollar and percentage differences, then breaking those down into price, volume, rate, and efficiency variances for a more granular view.
Basic Dollar and Percentage Variance Formulae
The formula Actual – Budget/Forecast is used to calculate basic dollar variance. Before calculating, however, it’s important to set clear benchmarks (e.g., measuring variance against the latest re-forecast).
Consistency in variance labelling is key, too (e.g., as favourable or unfavourable). A figure considered above is unfavourable for cost, but favourable for revenue.
Meanwhile, calculating percentages puts dollar figures in proportion (e.g., $30k over plan on a $2 million budget is trivial, while it’s significant on $100k). Use the formula (Actual – Budget/Forecast) ÷ Budget/Forecast × 100.
Price, Volume, Rate, and Efficiency Variance Formulae
Some scenarios require more than basic dollar and percentage calculations to break variance down further into contexts. For example, a $40k material cost variance suggests more units were used than forecasted, or that unit costs were higher than expected.
Variance
What It Measures
Formula
Price Variance
Difference between expected and actual material costs
(Actual Price – Standard Price) × Actual Quantity
Volume Variance
Actual number of products used vs. forecasted
(Actual Quantity Used – Expected Quantity) × Standard Cost per Unit
Rate Variance
Fluctuations in labour costs
(Actual Rate – Standard Rate) × Actual Hours Worked
Efficiency Variance
Cost-effectiveness of machines or physical labour
(Actual Hours Worked – Expected Hours Worked for Output Actually Produced) × Standard Rate
Worked example — Price Variance: A manufacturer budgeted £8.00 per unit for a steel component and used 12,000 units in the quarter. Actual price came in at £8.75 per unit.
The £9,000 gap tells finance the cost overrun came from price, not volume. Next step: investigate whether the supplier increase is temporary (a spot-market spike) or structural (a contract renegotiation), and whether it should be built into next quarter's forecast.
Worked example — Volume Variance: Same manufacturer, same component. Budget assumed 10,000 units at £8.00 per unit; actual usage was 12,000 units.
The volume variance is nearly twice the price variance, which points the investigation at production planning, not procurement. Was actual output higher than forecast? Was there rework or scrap? Was the standard usage rate itself set incorrectly? The answer determines whether the response is operational (fix the process) or planning (fix the standard).
Types of Variances Finance Teams Commonly Analyse
Finance and FP&A teams analyse variances in budget, forecast, cost and expense, and revenue and sales. In each case, teams must consider broad financial variances that establish what happened before moving on to their drivers.
Budget variances establish if a business stuck to a static financial plan.
Forecast variances measure how well finance and FP&A teams understand operational trajectory.
Cost and expense variances break down how much a project actually costs vs. how much was budgeted for it.
Revenue and sales variances identify the difference between actual income and forecast (split into price and volume).
How to Perform Variance Analysis Step by Step
Regardless of type and need, there are seven key steps to ensuring reliable data leads to root-cause analysis and an actionable management response.
1. Define the Benchmark and Scope
Choose a fixed benchmark (such as a static budget to assess if your spending discipline is meeting the goals you set last period) and consider the departments, time periods, or cost centres you want to compare.
2. Collect and Validate Actual and Planned Data
Collect the two data sets you intend to compare. Validating this data ensures it meets the parameters mentioned (which is more efficient when using automation).
3. Calculate and Prioritise Variances
Determine the variance analyses that will help to answer the question(s) determined at step one. For example, prioritise budget variance to build toward spending discipline analysis by subtracting budgeted from actual expense. Set materiality thresholds and rules so you focus on large swings that actually matter.
4. Decompose the Variance Into Drivers
With calculations, determine whether results are favourable or unfavourable, and decompose total variance into specific components to understand the underlying drivers (e.g., price and volume).
Rate Variance: A services firm forecasted 500 billable hours at £60 per hour (£30,000 planned labour cost). Actual came in at 500 hours at £68 per hour (£34,000 actual).
Because actual hours matched the plan exactly, the entire £4,000 gap is a rate issue — not efficiency. That points finance toward compensation changes, contractor mix shifts, or a shift toward more senior staff on the engagement. If hours had also risen, the analysis would need to separate rate from efficiency to isolate the drivers.
5. Determine Root Causes
Investigate the specific causes of variance, breaking down numbers in real time. Used effectively, AI can help detect anomalies and rank potential root causes by probability.
6. Interpret and Report the Findings
Build a complete report of findings, containing relevant variance data to act as a baseline for strategic adaptation. Assess the root causes suggested by your calculations, and determine whether swings and deviations are temporary or are deeper and structural.
7. Feed Findings Into Planning
From your report, clearly define opportunities that support future planning. Assign department leads to implement any fixes suggested, and update forecasts and baselines accordingly.
How to Interpret Favourable and Unfavourable Variances
Business context is crucial when interpreting variances, as they can be favourable or unfavourable. A favourable variance leaves a business better off than planned, while an unfavourable variance is the reverse.
For fair analysis, it’s important to consider materiality and persistence (e.g., prioritise targeting a small but consistently growing variance).
One-time effects can also skew results, such as emergency one-off costs, which don’t change your forward assumptions (unlike recurring costs).
Context is crucial. Some favourable variances, for example, can suggest a business is investing in cheap materials that lead to wastage, or that certain areas are being underfunded.
Best Practices and Common Pitfalls in Variance Analysis
Variance analysis shows decision-makers why a variance happened and suggests what to do in response. Interpreting variances effectively means accounting for business and operational realities while turning findings into decisions.
While focusing on mathematical differences between actuals and budget figures is technically correct, the basic maths doesn’t deliver actionable insights. Treating every variance as a problem, too, is time-consuming and unnecessary.
To avoid these pitfalls:
Set consistent materiality thresholds
Account for shifts caused by timing and seasonality (e.g., by adjusting a baseline to account for increased revenue during the holiday season)
Avoid assumptions and take time to validate root causes before reporting
Discard obsolete economic assumptions from analysis
Advanced Variance Analysis Methods and Tools
For maximum effectiveness, finance and FP&A teams must move beyond traditional analysis and follow sophisticated tactics. These should reduce manual investigation, build on basic actual vs. budget metrics, and drill deeper into drivers (without making routine analysis more complex).
Three key routes include using:
Flexible budget and driver-based analysis
Variance bridges and waterfall analysis
Automation, real-time data, and AI-assisted commentary
Flexible Budget and Driver-Based Analysis
Using flexible budgeting means budgets are recalculated at actual volumes achieved, helping to keep cost lines accurate. Driver-based analysis, used alongside, ties deviating figures to specific activities and causes.
For example, using driver-based analysis, finance and FP&A teams can link a drop in sales to reduced customer interest or seasonal demand, adding context to outcomes.
Variance Bridges and Waterfall Analysis
Tools such as variance bridges help visualise journeys between budgets and actuals, accounting for drivers as intermediate steps. Along the route, this visualisation shows how specific positive and negative drivers influence a figure (such as gross profit) to its final actual.
Variance bridges or waterfall charts contain bars that connect budgets and actuals in a storyline. It’s important to have a clear baseline and use consistent favourable/unfavourable colour coding and labelling for ease of reference.
Automation, Real-Time Data, and AI-Assisted Commentary
Finance and FP&A teams use financial automation and AI to pull and aggregate real-time data for more accurate, efficient, and repeatable variance analyses. For example, tools and data sets can be integrated to pool information into centralised sources automatically on a rolling basis.
AI can detect anomalies and suggest likely causes of variance by continuously analysing the information it pulls, delivering high-level commentaries that teams apply context and expertise to. Carefully managed AI in FP&A augments more efficient variance analysis and doesn’t replace analyst expertise.
Statistical and Predictive Approaches
Beyond flexible budgets and variance bridges, some teams apply statistical methods like one-way and two-way ANOVA to test whether differences across multiple categories (e.g., region, product line, time period) are statistically significant or just noise. Pairing this with trend analysis and predictive modelling helps teams separate structural drivers from one-time swings and forecast where variances are likely to appear next cycle.
Technology Enablement
An enterprise resource planning (ERP) system provides the transactional backbone for real-time data integration, while an AI-powered financial planning solution layered on top can build operating margin variance walks automatically; visually tracing how price, volume, and cost drivers moved margin from budget to actual. Comparing a fixed budget variance against a flexed one also clarifies whether a swing came from volume changes or genuine cost control.
Common Issues in Variance Analysis
Even well-run variance analysis processes run into recurring snags — from timing mismatches to unclear ownership. Here are the most common issues finance teams hit, and what tends to cause them.
Disconnected from FP&A objectives and KPIs – Variance analysis loses value when it's run as a standalone exercise instead of tied back to the financial statement and the KPIs, like operating margin, that leadership is actually tracking.
Lack of a consistent frame technique – Without a repeatable frame for categorising and prioritising variances, teams re-litigate the same questions every period instead of applying a standard policy for what gets investigated.
Weak cross-team collaboration – Major discrepancies often touch more than one department, and without input from the relevant stakeholders, root-cause analysis stalls or lands on the wrong explanation.
Confusing variance analysis with flux analysis – The two overlap but aren't identical and teams sometimes apply period-over-period flux logic to a budget-vs-actual question, muddying the benchmark.
Manual process, no variance analysis tools – Relying on static spreadsheets instead of dedicated tools makes it harder to catch operating margin variances early or pull case studies of how similar discrepancies were resolved in prior periods.
Conclusion: Turning Variance Analysis Into Better Decisions
Variance analysis is not about simply calculating the difference between budgets and actuals, but identifying specific performance gaps and their drivers.
With root-cause analysis, finance and FP&A teams can develop recommendations that inform more sustainable, growth-focused planning.
And, with reliable data aggregated in real-time, exploring drivers and root causes is less challenging and time-consuming.
Want to explore how automating variance analysis leads to more competitive decision-making? Take a Prophix One™ demo today.
FAQs
Q1. What causes variance analysis results to be misleading?
Variance analysis results can become misleading if baseline data is outdated or if forecasts are overly optimistic. What’s more, inconsistent data reporting and integration across platforms can cause technical errors.
Q2. Why do two teams sometimes get different variance numbers for the same period?
Two finance or FP&A teams getting different variance figures may follow different benchmarks or categorise costs differently. Or are pulling data from different systems over different time periods. One team may use a fixed budget and another a rolling forecast, and there may also be differences in when actuals are pulled from ledgers.
Q3. What if a variance keeps repeating every month?
Repeating variances suggest there are underlying forecasting or budgeting errors, for example, those that haven’t adjusted with rising supplier costs. Repeating variances can also indicate structural issues, and budgets should be adjusted.
Q4. What should you do when a variance looks unusual, but the cause is unclear?
In this scenario, always analyse data and system integrity to ensure there are no accounting or technical errors. Then, review initial budget assumptions and try to contextualise the cause (e.g., is it an isolated event, or have there been permanent changes in your operations?).