Our recent CFO Dive survey indicates that many finance leaders plan to invest in performance management and other automation tools in 2022. With 82% of organizations planning to increase their finance budgets, it's no wonder CFOs' priorities are shifting.
CFOs have recognized that they need to broaden their focus to encompass all their finance departments’ processes. Before the pandemic, CFOs spent most of their time focusing on budgeting, sales planning, and financial close. Although these processes are still relevant, forecasting, cash flow planning, and reporting have increased in importance over the last year.
That’s why our 2022.1.0 release includes strengthened reporting and analysis, captivating new Dashboard visuals, and improved interoperability with Excel.
Prophix Analyzer Enhancements
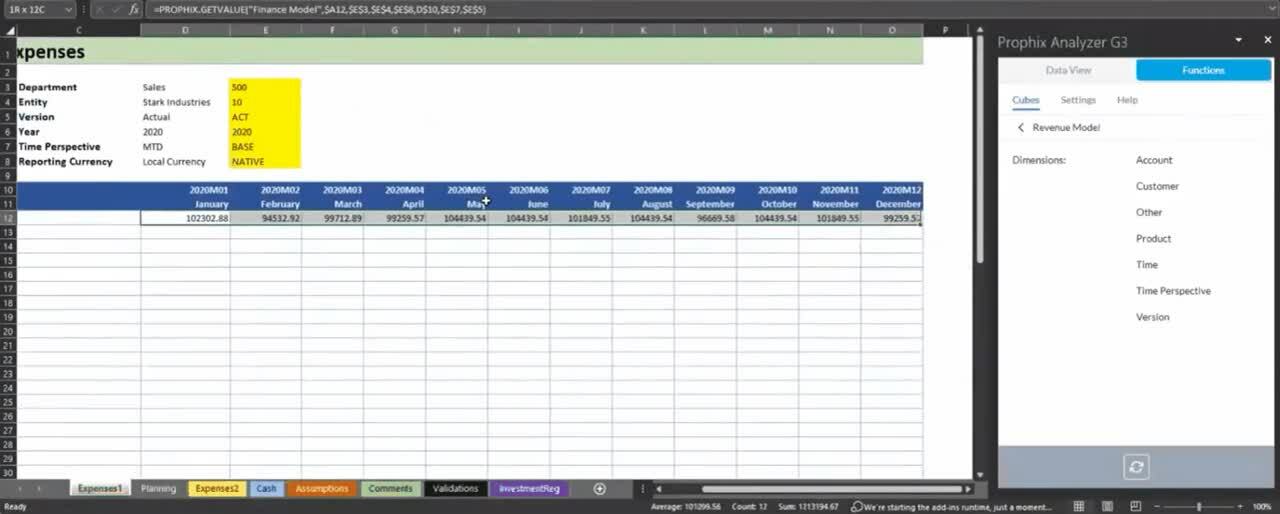
Sometimes when you have a difficult modeling use case that requires a proverbial whiteboard to make sense of things, it’s easier to work in Excel. At Prophix, we understand that some processes are better suited to a robust finance solution and others require more flexibility.
Company-wide Dashboards, the distribution of reports, and establishing rules for CAPEX planning are well-suited for Corporate Performance Management (CPM) software. However, it may be easier to start with a blank Excel spreadsheet when you want to experiment with your models.
Prophix Analyzer, part of Prophix for Microsoft 365, allows Prophix to become the primary data source for Excel modeling and analysis. With Prophix Analyzer, you can securely view and manipulate live Prophix data using Excel while still maintaining a link back to your Prophix database, so you can always pull the latest data for further analysis.
In this release, we’ve also developed a more flexible way to export your Prophix data into Excel. By providing you with the flexibility to model in your interface of choice, you can improve the efficacy of your Corporate Performance Management (CPM) software.
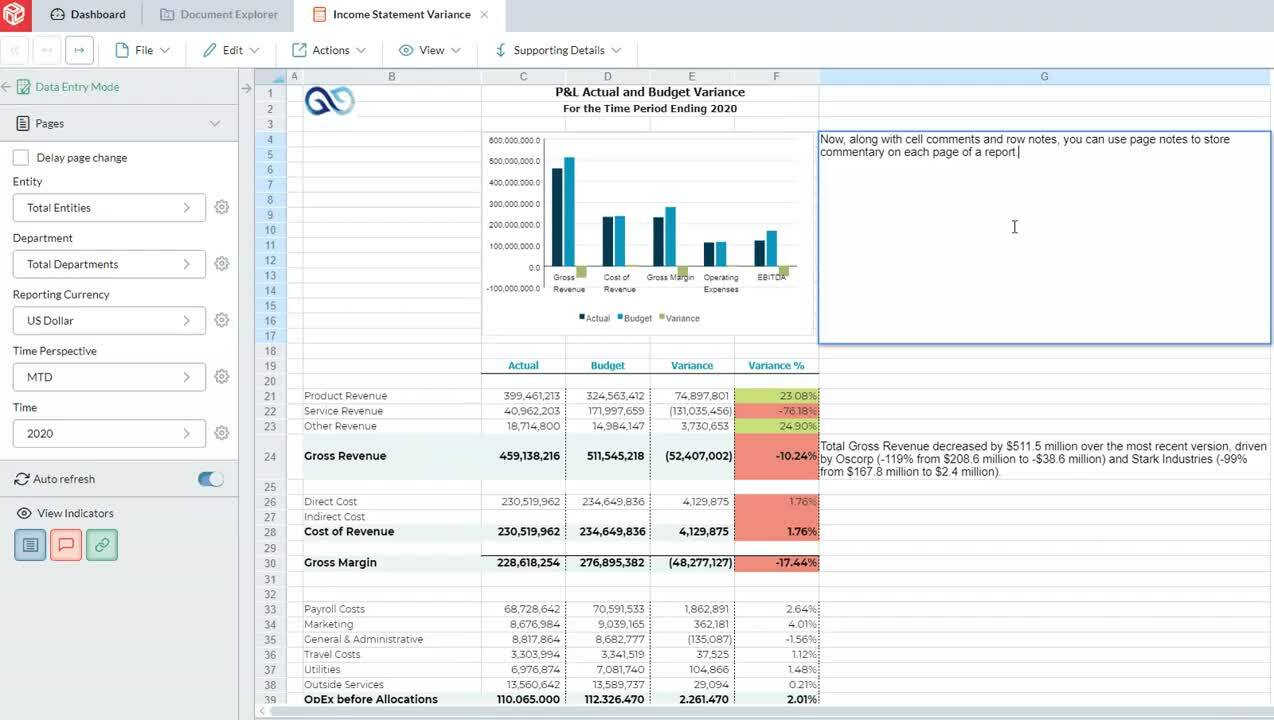
Page Notes in Reports and Templates
Validated and balanced numbers are non-negotiable for finance teams. But once your data is compiled, the words you use to explain the trends you see are just as important as accurate data. Commentary is an underrated aspect of reporting that historically has had a poor track record of making it into the right hands and being documented correctly.
Prophix has a powerful arsenal of documentation capabilities to maximize the commentary you can provide on business trends – with a focus on transparency, auditability, and trackability. To give you more flexibility around communicating the ‘what’ and ‘why’ of your data, we’ve introduced Page Notes.
Page Notes enables you to present summary commentary on trends and changes in your business. The result is more meaningful reports with information on your company’s performance, position, and process included on each unique page.
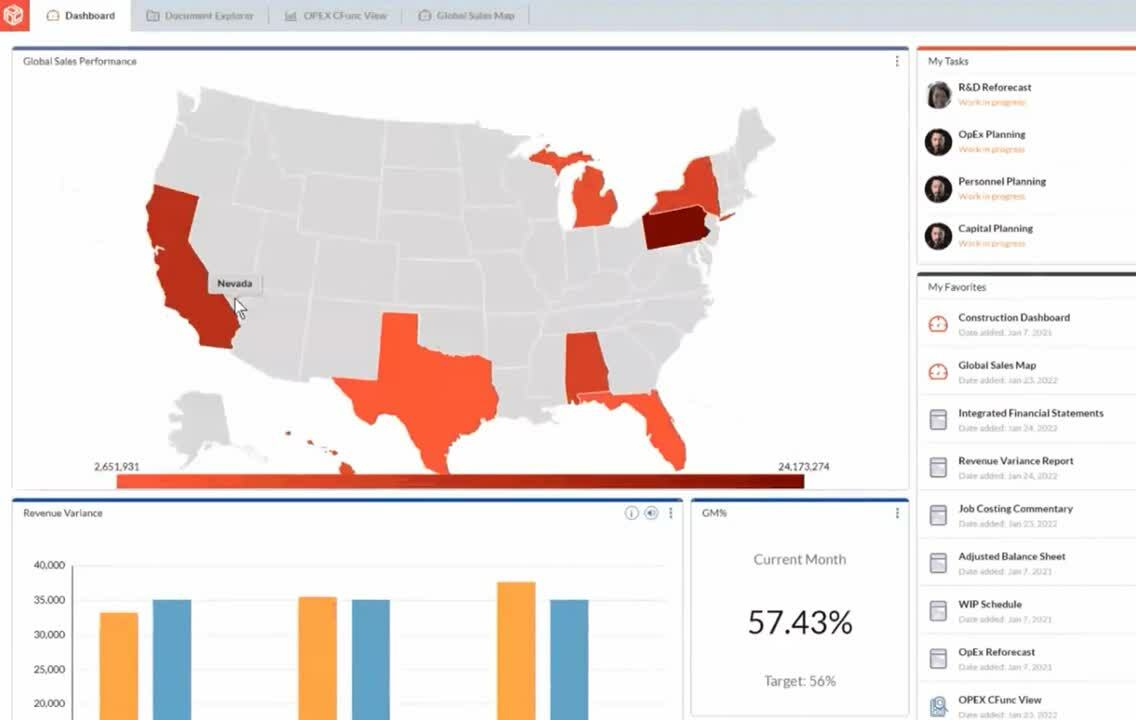
GeoMap Dashboard Chart
When it comes to making sense of your business data, visuals are the perfect starting point. Prophix’s self-service Dashboards allow you to start your day informed on your company’s performance. With an overview of your key metrics and KPIs, you can identify, monitor, measure, and analyze the insights most important to your organization’s success.
In the 2022.01 release, users can also create GeoMap visualizations that track metrics and performance across a region, country, or the entire globe.
 To learn more about these capabilities and other exciting enhancements in this release, visit our 2022.1.0 Release Page.